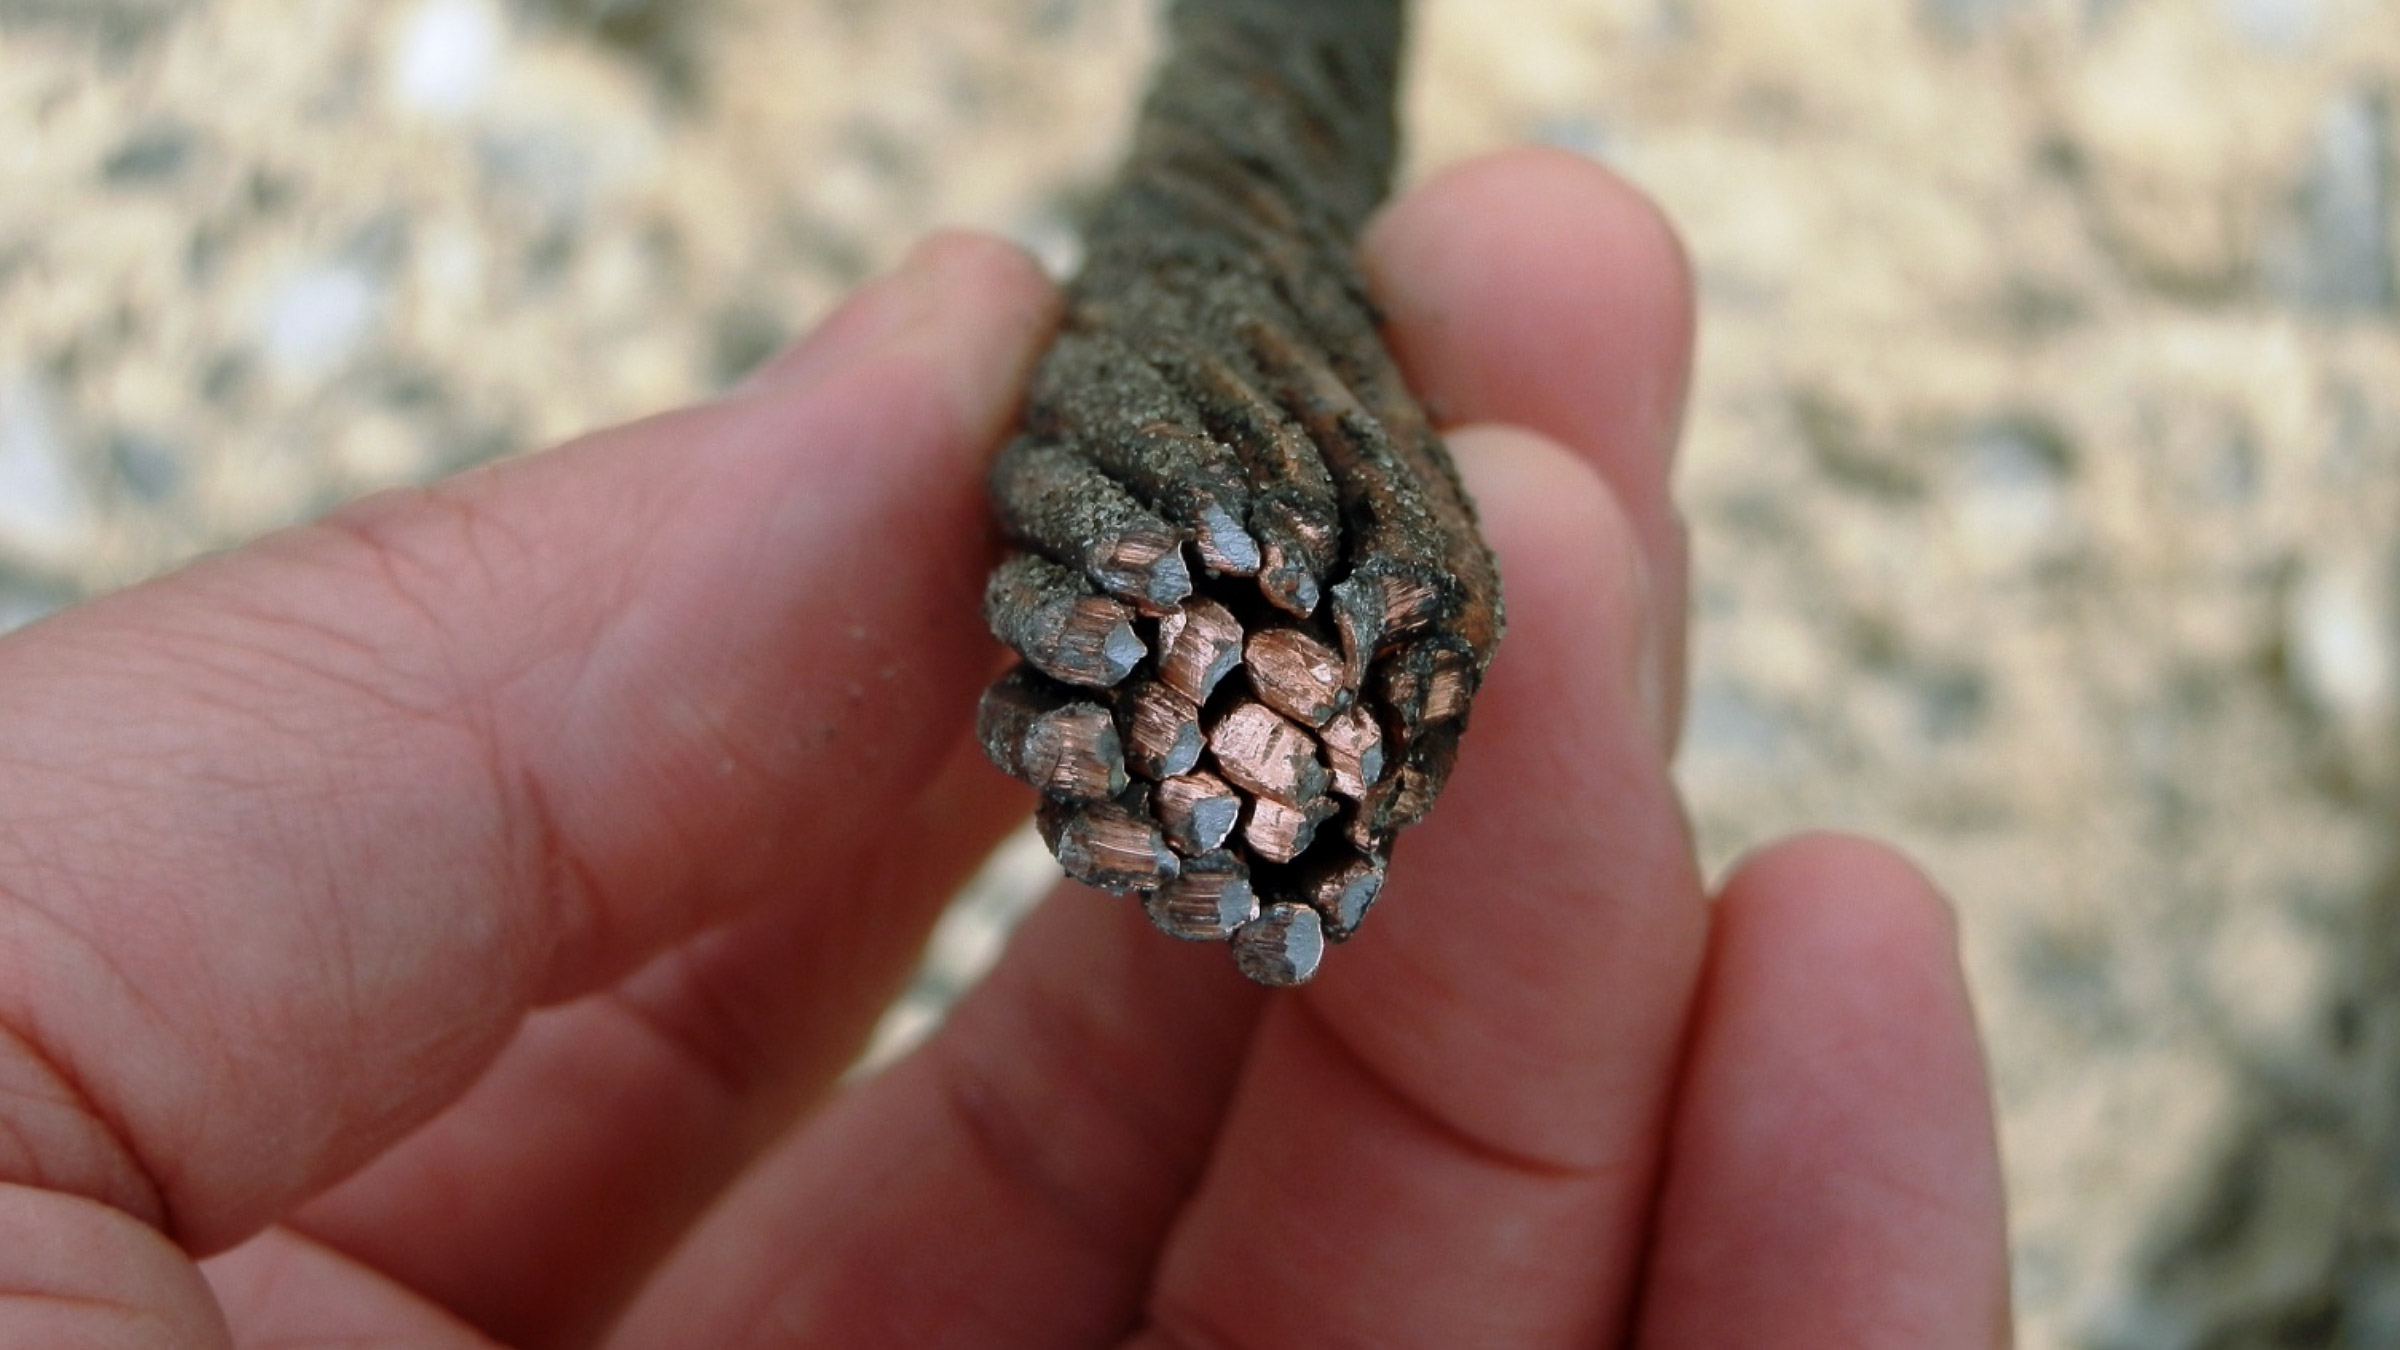
This paper presents empirical evidence spanning several decades that questions the conventional short circuit performance calculations used to select copper-covered or copper-clad steel (CCS) conductors in grounding applications as shown in Figure 1.
The best grounding and electromagnetic effects software model in today’s industry is the one that predicts. The design community requires an accurate and predictive software model to aid their selection of conductors for grounding applications. With the goal of establishing baseline CCS performance, tests were conducted to discover x-y intercepts on graphs depicting short circuit current (ISC) and fault current duration (time) that predict the destruction of continuity in the field by a process called fusing. The results suggest that the IEEE Std 80 methodology for determining the ultimate current carrying capability of CCS does not accurately predict its performance.
CCS was used in applications ranging from telephone communication wiring to grounding conductors from the early 1900s through the 1960s. In rural communities, CCS was used as a power conductor to electrify farms. For example, we have confirmed over 100 sites in Kearney, Nebraska that were installed in 1946 to power aqueduct irrigation pumps on farms—presently in use today 73 years after installation.
CCS is commonly compared by its electrical conductivity properties relative to copper, using the International Annealed Copper Standard (IACS). However, this standard assumes steady-state current carrying capability.
To better understand the applicability of CCS in non-steady-state grounding current applications, Copperweld Bimetallics, then called Copperweld Steel Company of Pittsburg, began testing its own products in 1971.
Testing took place at A. B. Chance Co., a specialized high power test lab, where short circuit currents were injected into various CCS sample conductors. Currents were selected to represent field conditions that could potentially arise from a line to ground fault. During each test, the CCS conductor burned apart and interrupted the circuit like a high power fuse, designating the fusing limit. Current and time were measured accurately by counting the alternating cycles of the AC current sine wave on an oscilloscope graph. A successful test 10% below the fusing limit—often causing the cable to glow a cherry red—was used to confirm the limit. Charting the fusing limits of three or four different maximum currents in this way, a trend line for the performance of each conductor was empirically determined and then extrapolated for other time-current pairs.
An excerpt of the original time-current tests performed at A. B. Chance Co. is provided in Table 1. Testing indicated that, size-for-size, Copperweld CCS (40% IACS) fusing limit is about 80-85% that of copper in grounding applications.1, 2, 3

Using this data, approximate fusing currents for CCS conductors were calculated in 1972. 4 By the end of the 1970s, CCS was used in buried grounding applications such as ground grid conductors at substations, as well as exposed grounding applications in power distribution poles and substation equipment. 5, 6, 7
Derived from empirical evidence in this way, the predictive short circuit fusing current (ISC) formula for CCS was determined as follows:
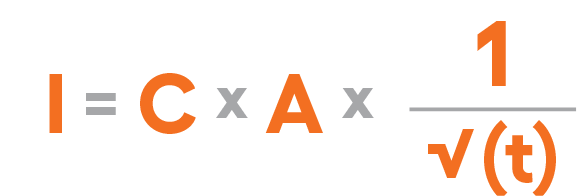
Where,
I = short circuit fusing current
C = conductor factor
A = cross-sectional area in kcmil
t = time in cycles
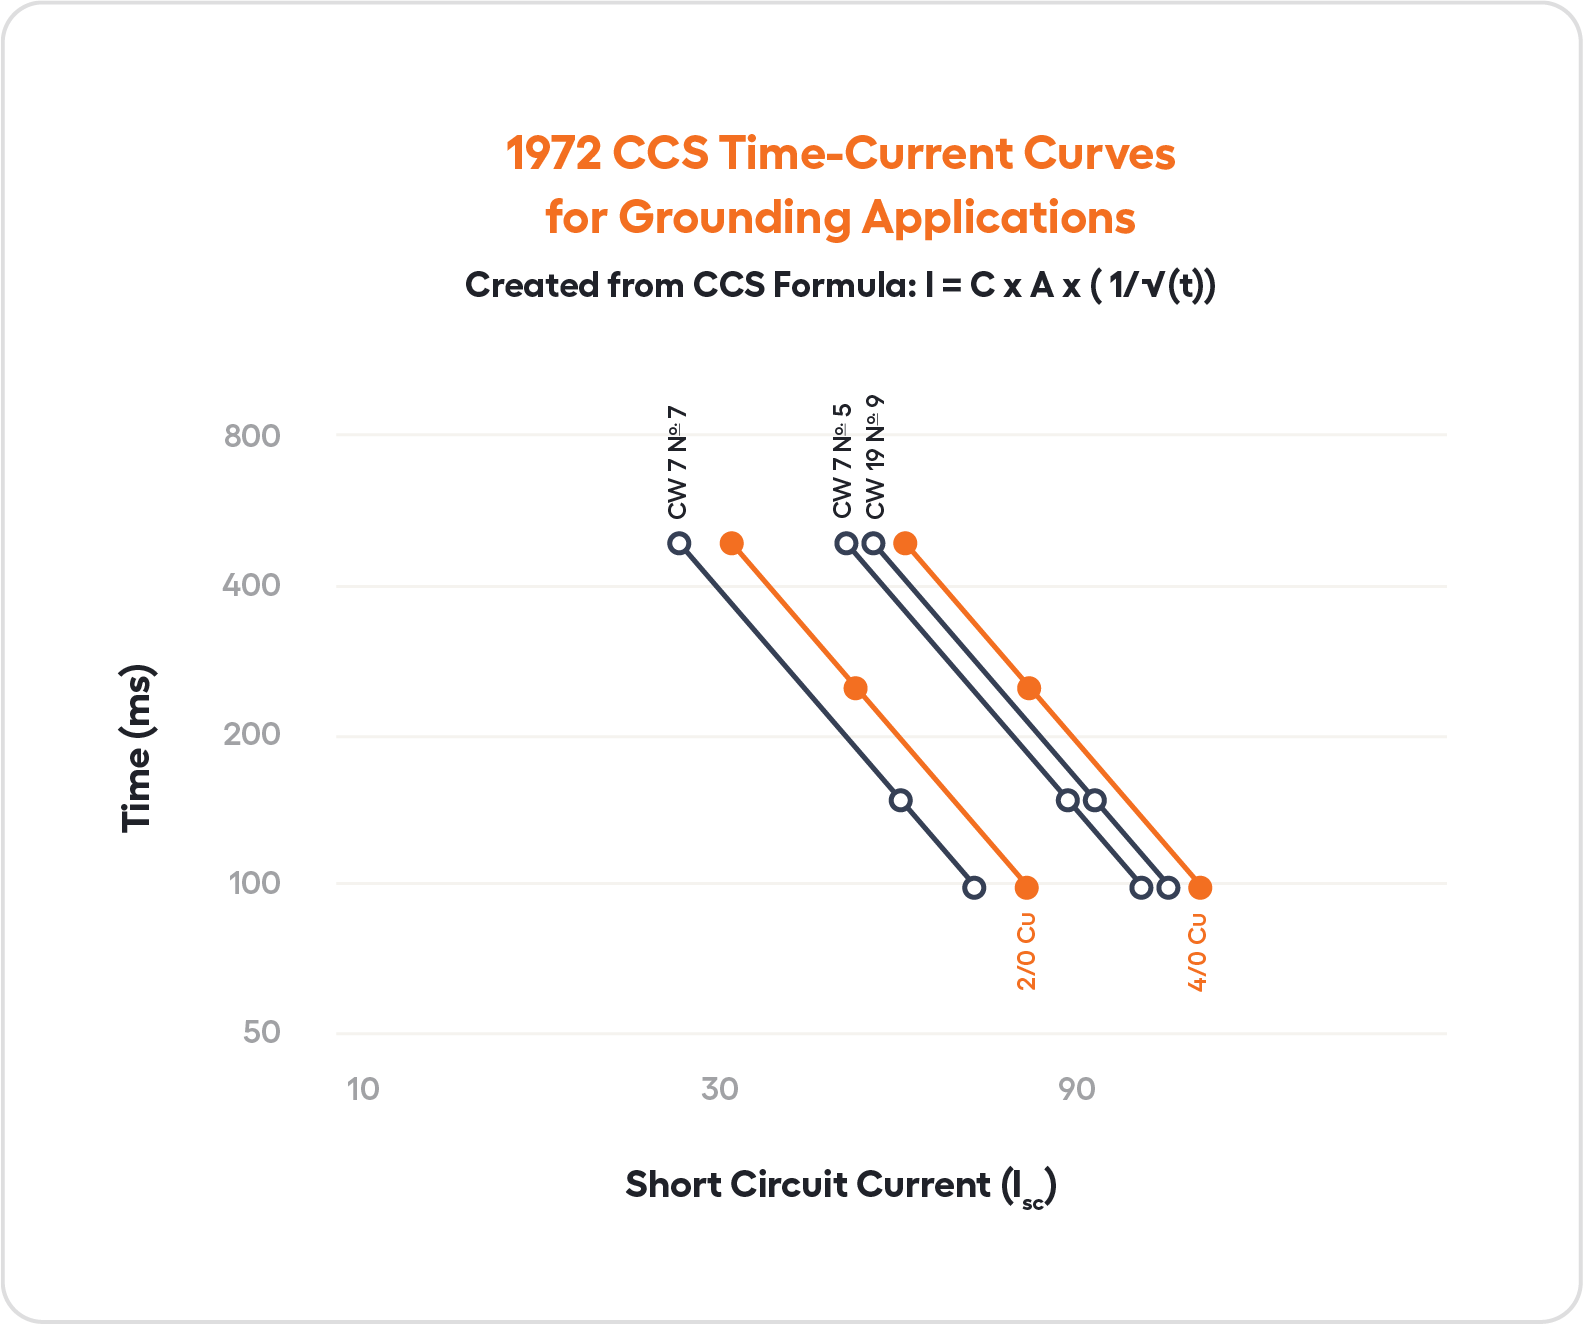
Eventually, a full set of curves was published for the fusing limit of any CCS conductor size. Figure 2 presents a few examples using the formula and comparable curves for copper. (Values for soft drawn copper in Figure 2 are taken from IEEE Std 80-2013, Table 6.) 8
Conventional standards in the grounding community today can be traced to 1981.
In that year, J. G. Sverak proposed a change to IEEE Std 80 for two reasons: 1) to better reflect the short circuit current fusing limit performance of soft drawn copper cables with regard to the dissipation of heat during a fault, and 2) to permit convenient comparison of alternative conductors to the copper standard by theoretical calculation. After the Committee’s review, his proposal was accepted. 9
Sverak’s formula is found in IEEE Std 80-2013 in this form today. 8

We do not wish to challenge the preeminence of Sverak’s formula for predicting the performance of copper grounding solutions related to reason 1. However, this paper does address a potential flaw in the adoption of his formula for reason 2.
Sverak’s 1981 paper identifies the primary reason for consideration of his formula is to address the “inability to evaluate and compare the ampacities of a variety of conductors” with respect to copper. However, ampacities have been tested in the past and can be verified today. Rather than establish a single universal formula for all conductors based on their theoretical performance, it is possible and more accurate to evaluate conductors at the test lab. A universal formula for all conductors may or may not arise from these tests, but that has yet to be determined. Any predictive modeling methodology must be made to fit the available empirical data, and not the other way around.
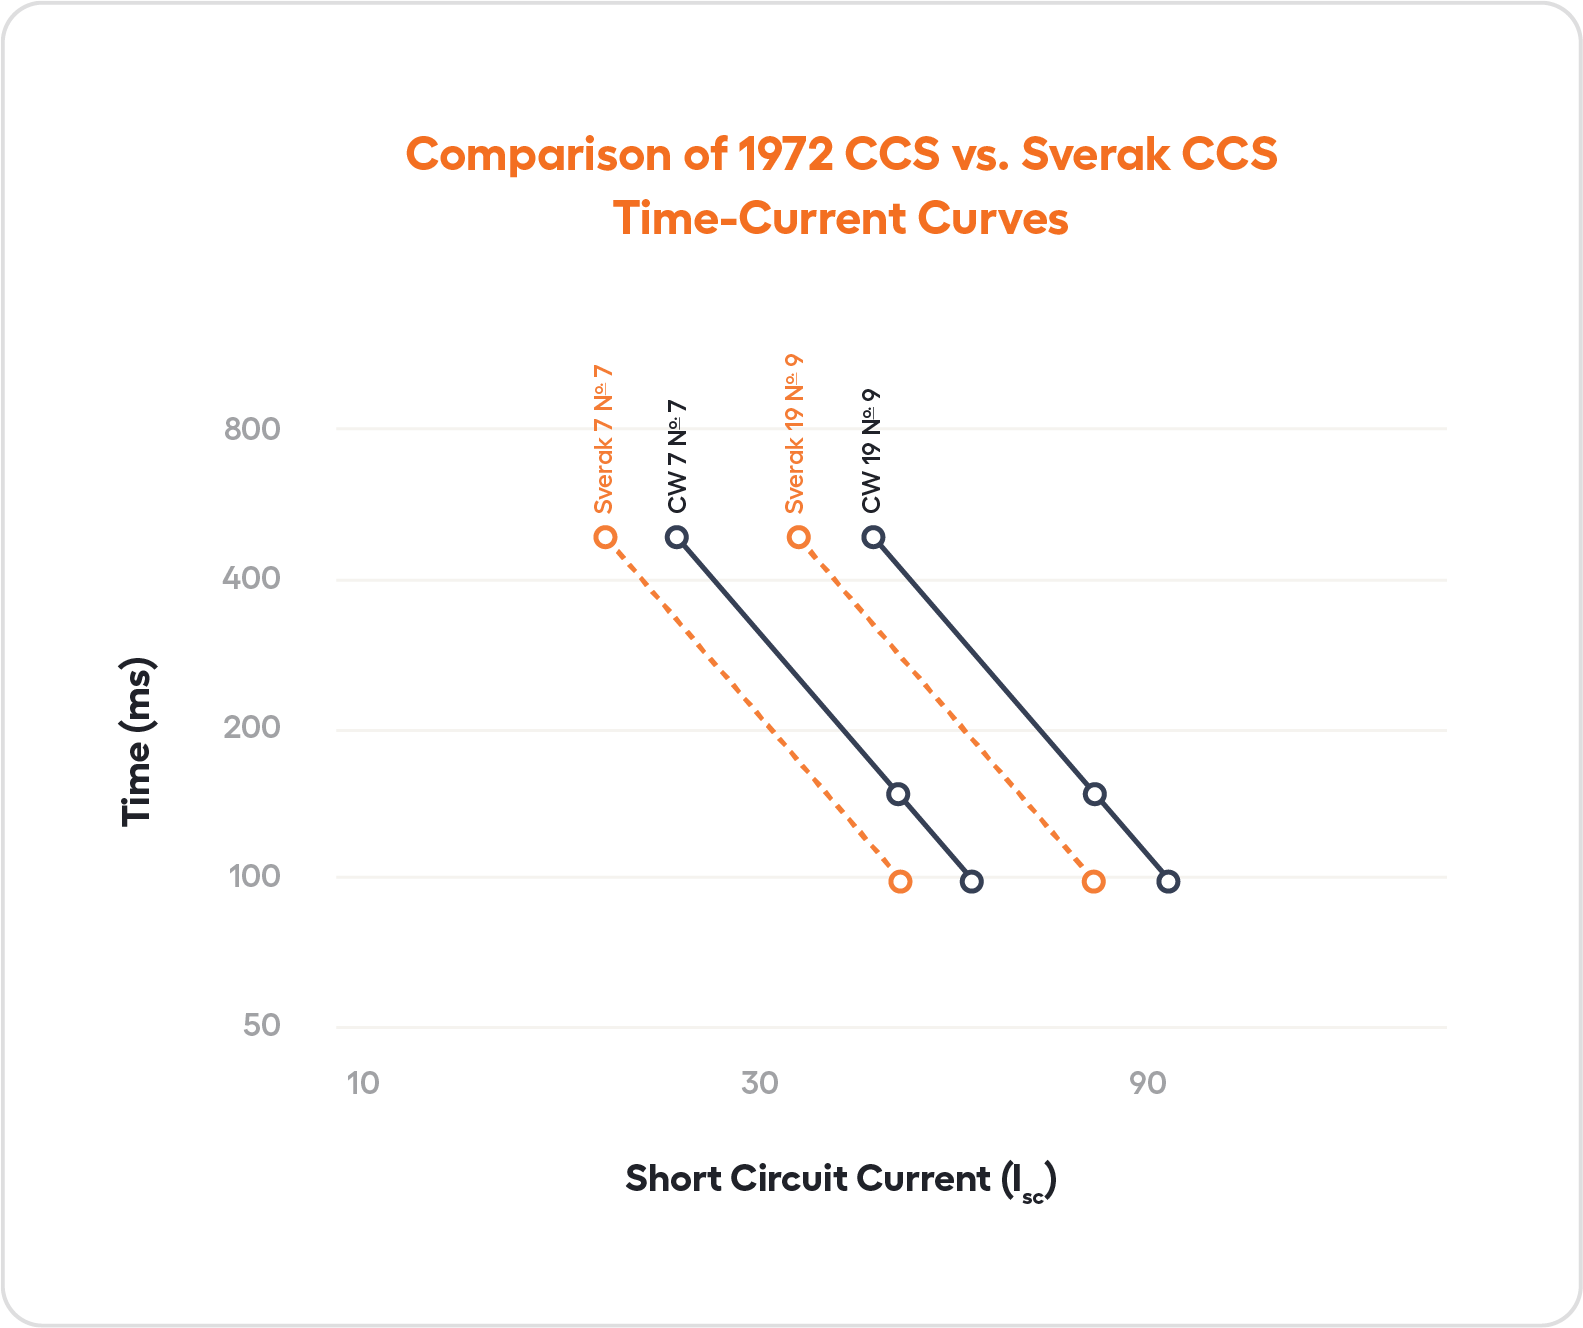
Results of Sverak’s formula did not match previously accepted values for CCS performance leading us to speculate on its ability to properly evaluate other bimetallic conductors. Figure 3 shows the gap between the 1972 CCS formula and the 1981 Sverak formula. The overwhelming predominance of the Sverak formula in the years after 1981 appears to have influenced later CCS manufacturer’s literature, e.g. Copperweld’s Engineering Document 1790. 10 The question was reopened once again when testing in 2008 resulted in performance values that exceeded the Sverak calculation. 11
In an attempt to resolve the matter, we opened a new test program at a premier test lab in Vancouver, BC, Canada in 2018. This particular test lab has the distinction of once having been connected to the local power grid, and so, can deliver very high power on demand with accuracy.
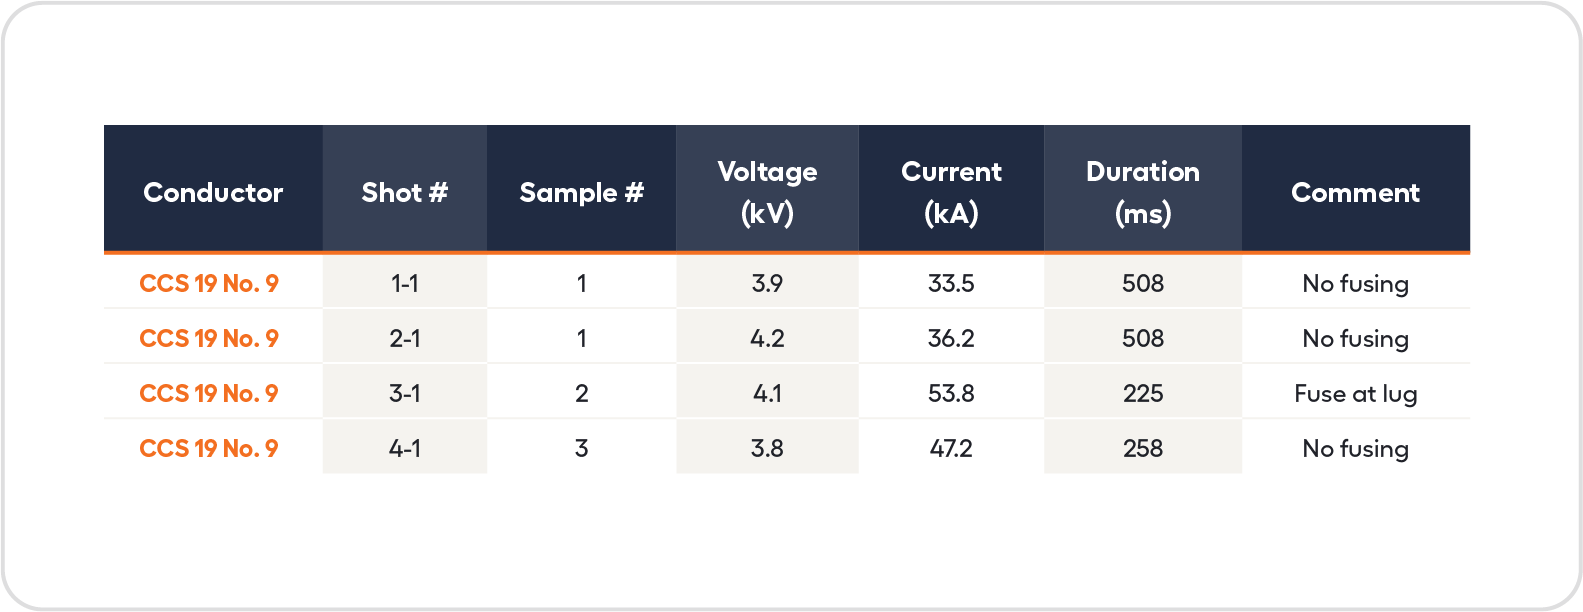
According to the Sverak formula, CCS 19 no. 9 is capable of carrying a maximum of 34 kA for up to 500 ms before destructively fusing, which causes an interruption of the circuit. The 500 ms duration ISC fault condition (also known as 30 cycles and momentary interruption) was selected because of its popularity among utility customers for grounding selection criteria. Maximum current carrying capacity is not easily measured. Rather, the fusing condition is typically measured.
Table 2 shows that a single sample was tested twice. It was shot at 34kA for 500 ms, and then it was shot again at 36kA for 500 ms. It did not fuse. The maximum current carrying limit predicted by the Sverak formula was exceeded. The fusing limit was unable to be identified.
Similarly, CCS 7 no. 7 is capable of carrying a maximum of 21 kA for up to 500 ms before destructively fusing.
Table 3 shows a sample of 7 No. 7 was injected with 21kA for 500 ms without fusing. Similarly, just as in the 2018 test of 19 No. 9, the maximum limit of 20kA predicted by the Sverak formula was exceeded.
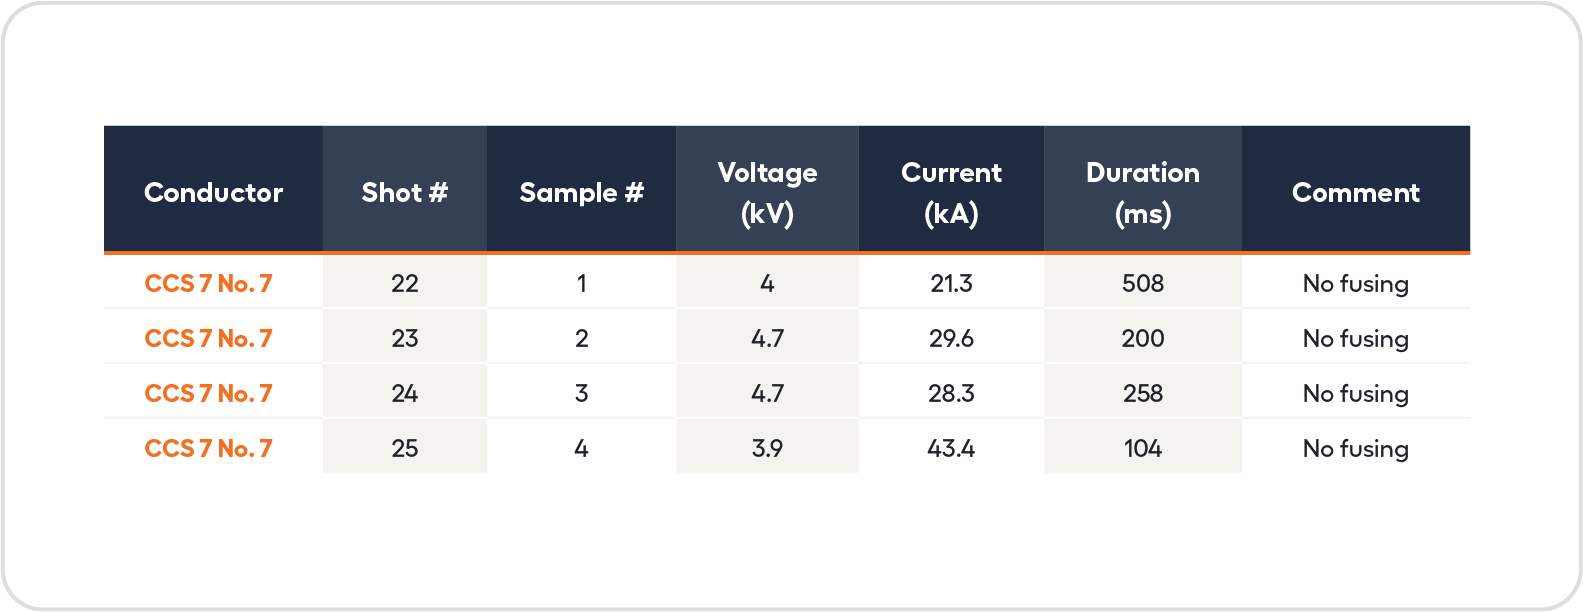
Figure 4 shows graphically how the 2018 and 2019 test values exceeded the predictions of the Sverak equation for CCS in both 19 No. 9 and 7 No. 7 conductor sizes. Test values for durations smaller than 500 ms are limited due to movement in the apparatus that strained the test samples.

Other verification tests demonstrated the same mode of failure at the lugs described in the original 1971 test at A.B. Chance Co. laboratories, as shown in Figure 5. In more recent verification tests, lugs were oversized in an attempt to remove this as a possible mode of failure.

For tests near the fusing limit, video evidence of the cherry red condition captured in Figure 6 shows a moment in time before the ultimate current-carrying limit. Once cooled, the conductor that exhibited the cherry red condition was tested again at the same fault current without fusing. Further work needs to be performed to verify time-current curves for fault durations less than 500 ms, which will require more stable test apparatus to restrict motions from magnetic effects leading to premature conductor failure.

Copperweld's friendly sales team is ready to fill your order or help you select products to deliver the performance you need.
Follow us on your favorite social platforms:


Sign up for Copperweld news to learn about the latest industry updates, events, product releases, videos and technical documents.